Quickstart#
Installation#
FairLens can be installed using pip
pip install fairlens
Assessing Fairness#
The class fairlens.FairnessScorer can be used to automatically generate a fairness report on a
dataset, provided a target column. The target column is a column we want to be independent of
of the sensitive attributes. We can analyze inherent biases in a dataset used for supervised learning
by passing in the the name of a desired output column. Alternatively, to assess the fairness of a
machine learning task on a dataset we can pass in the predicted column instead.
Below we show an assessment of fairness on a subset of Propublica’s COMPAS dataset with respect to the attribute “RawScore”, which was indicative of an offender’s likelihood to reoffend.
In [1]: import pandas as pd

In [2]: import fairlens as fl

In [3]: df = pd.read_csv("../datasets/compas.csv")

In [4]: df.info()
<class 'pandas.core.frame.DataFrame'>
RangeIndex: 20281 entries, 0 to 20280
Data columns (total 22 columns):
 #   Column                   Non-Null Count  Dtype
---  ------                   --------------  -----
 0   PersonID                 20281 non-null  int64
 1   AssessmentID             20281 non-null  int64
 2   CaseID                   20281 non-null  int64
 3   Agency                   20281 non-null  object
 4   LastName                 20281 non-null  object
 5   FirstName                20281 non-null  object
 6   MiddleName               5216 non-null   object
 7   Sex                      20281 non-null  object
 8   Ethnicity                20281 non-null  object
 9   DateOfBirth              20281 non-null  object
 10  ScaleSet                 20281 non-null  object
 11  AssessmentReason         20281 non-null  object
 12  Language                 20281 non-null  object
 13  LegalStatus              20281 non-null  object
 14  CustodyStatus            20281 non-null  object
 15  MaritalStatus            20281 non-null  object
 16  ScreeningDate            20281 non-null  object
 17  RecSupervisionLevelText  20281 non-null  object
 18  RawScore                 20281 non-null  float64
 19  DecileScore              20281 non-null  int64
 20  ScoreText                20245 non-null  object
 21  AssessmentType           20281 non-null  object
dtypes: float64(1), int64(4), object(17)
memory usage: 3.4+ MB

In [5]: fscorer = fl.FairnessScorer(df, "RawScore")

In [6]: fscorer.sensitive_attrs
Out[6]: ['DateOfBirth', 'Ethnicity', 'Language', 'MaritalStatus', 'Sex']

In [7]: fscorer.plot_distributions()
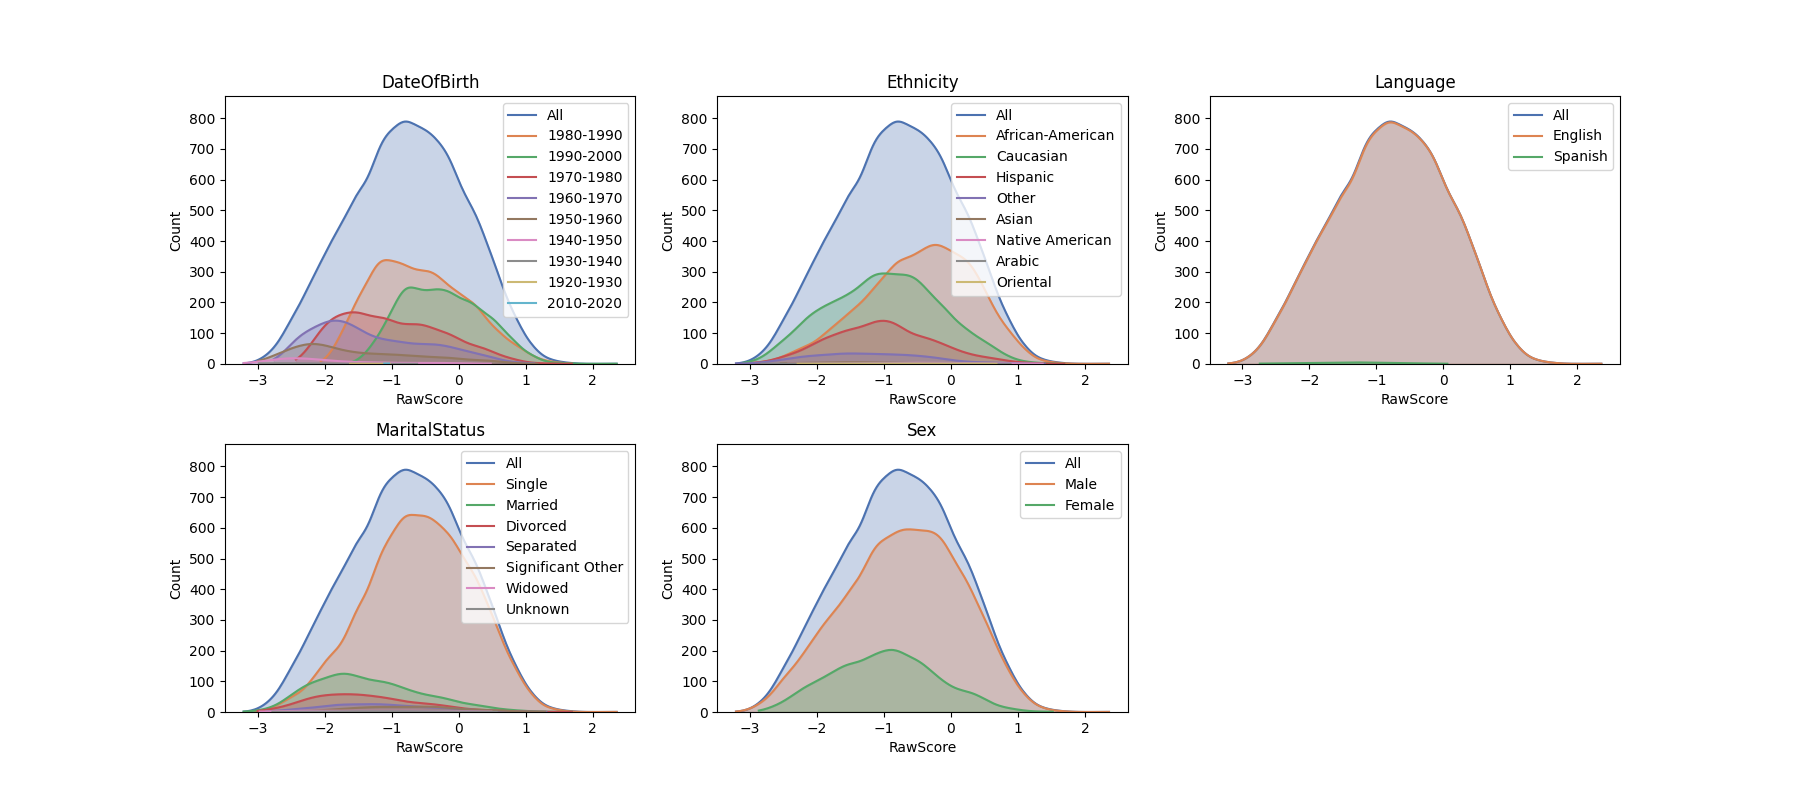
From the plots, we can start to get an idea of where certain prejudices may occur. However, what’s more important is that we aren’t prejudicing a very specific subgroup of sensitive attributes. The fairness scorer can iterate through all possible combinations of these sensitive demographics and use statistical distances to produce an estimate of how independent the distribution of “RawScore” is to the sensitive groups.
At this point we may also find that we want to focus on a subset of the sensitive attributes, in which case we can reinitialize the fairness scorer with new ones.
In [8]: fscorer = fl.FairnessScorer(df, "RawScore", ["Ethnicity", "Sex", "MaritalStatus"])

In [9]: fscorer.demographic_report(max_rows=20)
Sensitive Attributes: ['Ethnicity', 'MaritalStatus', 'Sex']

                         Group Distance  Proportion  Counts   P-Value
African-American, Single, Male    0.249    0.291011    5902 3.62e-251
      African-American, Single    0.202    0.369163    7487 1.30e-196
                       Married    0.301    0.134313    2724 7.37e-193
        African-American, Male    0.201    0.353138    7162 4.03e-188
                 Married, Male    0.281    0.108229    2195 9.69e-139
              African-American    0.156    0.444899    9023 3.25e-133
                      Divorced    0.321    0.063754    1293 7.51e-112
            Caucasian, Married    0.351    0.049504    1004 7.73e-106
                  Single, Male    0.121    0.582910   11822  3.30e-95
           Caucasian, Divorced    0.341    0.037473     760  1.28e-76
      Caucasian, Married, Male    0.338    0.036389     738  4.46e-73
               Married, Female    0.389    0.026084     529  5.51e-71
             Hispanic, Married    0.369    0.029190     592  1.04e-70
                        Single    0.094    0.741679   15042  2.31e-66
                Divorced, Male    0.288    0.045412     921  2.43e-65
                      Hispanic    0.164    0.143681    2914  5.07e-60
                Other, Married    0.526    0.011439     232  1.70e-59
              Divorced, Female    0.422    0.018342     372  2.14e-59
       Hispanic, Married, Male    0.355    0.024802     503  5.12e-56
                     Caucasian    0.107    0.358020    7261  2.33e-53

Weighted Mean Statistical Distance: 0.14081832462333957
This gives us a much clearer picture and both of the above suggest that there is a tendency for “RawScore” being higher for people of in the group “African-American” and “Male” than in the rest of the data.
Note
As you may be able to tell from above, for many distance metrics there isn’t a concept of positive or negative distances, which means that the fairness scorer will flag a skew in either direction.