Fairness Scorer#
The class fairlens.FairnessScorer can be used to automatically analyze a dataset and assess fairness.
The fairness scorer takes in 2 parameters, the dataset in a dataframe, and a target variable. The target variable can be the output column of the dataset or the result of a prediction made by a model on the dataset. The sensitive attributes are automatically detected, but users can be explicit and pass them in. Additionally, the user can choose to be explicit about the the type of data in each column i.e. categorical, continuous, binary, date; however, by default this is automatically inferred.
The fairness scorer aims to measure group fairness; i.e. if the chosen target column is independent of the sensitive attributes in a row. If the distribution of the target column in each subgroup of sensitive values isn’t significantly different to the overall distribution, then we assume independence. Hence to find the most prejudiced subgroups we can use statistical distances and hypothesis tests to measure the significance of the skew in each subgroup.
Report Generation#
The fairness scorer supports three different methods for report generation.
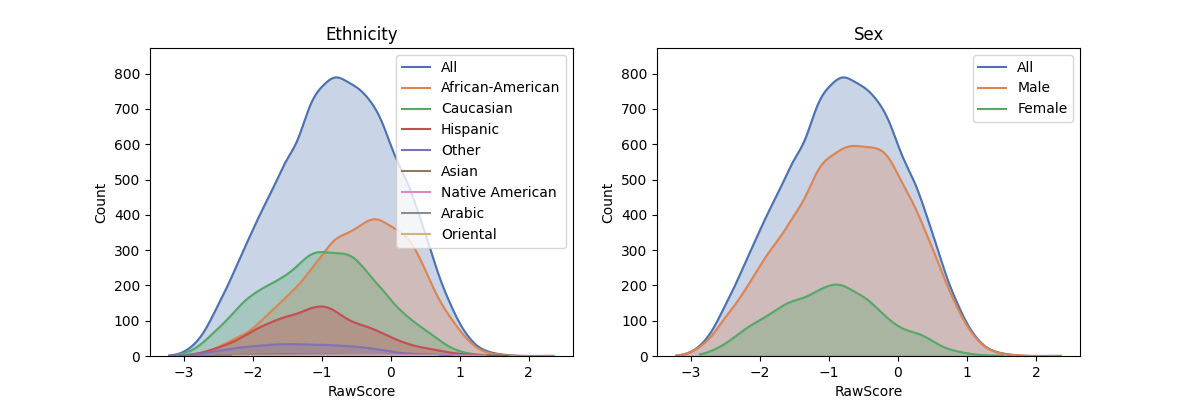
The plot_distributions method produces plots of the distribution of the target variable in each subgroup
in a column, for each column. This is useful for understanding the different distributions of protected groups
and identifying any inherent biases present in a dataset.
In [1]: import pandas as pd

In [2]: import fairlens as fl

In [3]: df = pd.read_csv("../datasets/compas.csv")

In [4]: df.info()
<class 'pandas.core.frame.DataFrame'>
RangeIndex: 20281 entries, 0 to 20280
Data columns (total 22 columns):
 #   Column                   Non-Null Count  Dtype
---  ------                   --------------  -----
 0   PersonID                 20281 non-null  int64
 1   AssessmentID             20281 non-null  int64
 2   CaseID                   20281 non-null  int64
 3   Agency                   20281 non-null  object
 4   LastName                 20281 non-null  object
 5   FirstName                20281 non-null  object
 6   MiddleName               5216 non-null   object
 7   Sex                      20281 non-null  object
 8   Ethnicity                20281 non-null  object
 9   DateOfBirth              20281 non-null  object
 10  ScaleSet                 20281 non-null  object
 11  AssessmentReason         20281 non-null  object
 12  Language                 20281 non-null  object
 13  LegalStatus              20281 non-null  object
 14  CustodyStatus            20281 non-null  object
 15  MaritalStatus            20281 non-null  object
 16  ScreeningDate            20281 non-null  object
 17  RecSupervisionLevelText  20281 non-null  object
 18  RawScore                 20281 non-null  float64
 19  DecileScore              20281 non-null  int64
 20  ScoreText                20245 non-null  object
 21  AssessmentType           20281 non-null  object
dtypes: float64(1), int64(4), object(17)
memory usage: 3.4+ MB

In [5]: fscorer = fl.FairnessScorer(df, "RawScore", ["Ethnicity", "Sex"])

In [6]: fscorer.plot_distributions()
The demographic_report estimates the extent to which the distribution of the target column is independent
of the sensitive attributes. This is done by using a suitable distance metric to test the significance of the
distance between the distributions of each senstitive demographic and the overall population. In the below case,
our target variable, “RawScore”, is continuous, so the Kolmogorov Smirnov test is carried out by default.
This process is done on all possible demographics for the given sensitive attributes. This report produces a
list of the most prejudiced groups (i.e. largest distance / p-value) by this criterion.
In [7]: fscorer.demographic_report()
Sensitive Attributes: ['Ethnicity', 'Sex']

                 Group Distance  Proportion  Counts   P-Value
African-American, Male    0.201    0.353138    7162 4.03e-188
      African-American    0.156    0.444899    9023 3.25e-133
              Hispanic    0.164    0.143681    2914  5.07e-60
             Caucasian    0.107    0.358020    7261  2.33e-53
                Female    0.127    0.219072    4443  1.53e-51
     Caucasian, Female    0.176    0.089295    1811  1.70e-45
      Hispanic, Female    0.279    0.028450     577  4.77e-39
                 Other    0.220    0.042601     864  9.90e-36
        Hispanic, Male    0.136    0.115231    2337  2.32e-34
       Caucasian, Male    0.087    0.268724    5450  7.19e-29

Weighted Mean Statistical Distance: 0.11587609533968031
Users can also opt to measure the distance between the distributions in the subgroup and the data without the subgroup as an alternative.
In [8]: fscorer.demographic_report(method="dist_to_rest")
Sensitive Attributes: ['Ethnicity', 'Sex']

                 Group Distance  Proportion  Counts   P-Value
      African-American    0.281    0.444899    9023  0.00e+00
African-American, Male    0.311    0.353138    7162  0.00e+00
             Caucasian    0.166    0.358020    7261 8.93e-113
                  Male    0.162    0.780928   15838  2.14e-80
                Female    0.162    0.219072    4443  2.14e-80
              Hispanic    0.191    0.143681    2914  3.54e-80
     Caucasian, Female    0.193    0.089295    1811  2.20e-54
       Caucasian, Male    0.119    0.268724    5450  7.90e-50
        Hispanic, Male    0.154    0.115231    2337  3.05e-43
      Hispanic, Female    0.287    0.028450     577  2.19e-41

Weighted Mean Statistical Distance: 0.19632255130989817
Scoring API#
Individual functions of the demographic report can be called for further analysis.
In [9]: sensitive_attrs = ["Ethnicity", "Sex"]

In [10]: target_attr = "RawScore"

In [11]: fscorer = fl.FairnessScorer(df, target_attr, sensitive_attrs)

In [12]: df_dist = fscorer.distribution_score()

In [13]: df_dist
Out[13]:
                       Group  Distance  Proportion  Counts
0                  Caucasian  0.106594    0.358020    7261
1           African-American  0.156011    0.444899    9023
2                   Hispanic  0.163547    0.143681    2914
3                      Other  0.220045    0.042601     864
4                      Asian  0.320241    0.005325     108
5            Native American  0.186467    0.003599      73
6                   Oriental  0.306338    0.000641      13
7                     Arabic  0.163487    0.001233      25
8                       Male  0.035569    0.780928   15838
9                     Female  0.126795    0.219072    4443
10           Caucasian, Male  0.087198    0.268724    5450
11    African-American, Male  0.201106    0.353138    7162
12  African-American, Female  0.050609    0.091761    1861
13            Hispanic, Male  0.136174    0.115231    2337
14         Caucasian, Female  0.175940    0.089295    1811
15               Other, Male  0.196701    0.035156     713
16          Hispanic, Female  0.278789    0.028450     577
17               Asian, Male  0.307059    0.004388      89
18             Other, Female  0.361963    0.007445     151
19             Asian, Female  0.422706    0.000937      19
20   Native American, Female  0.217331    0.000986      20
21     Native American, Male  0.191119    0.002613      53
22            Oriental, Male  0.274779    0.000493      10
23              Arabic, Male  0.175154    0.001183      24
24            Arabic, Female  0.773877    0.000049       1
25          Oriental, Female  0.460184    0.000148       3